


You've got Google Analytics set up. You're checking your dashboard every week (maybe every day). Numbers are going up, numbers are going down. But here's the real question: do you actually know what any of it means for your business?
Website analytics can be incredibly powerful. They can also lead you down a rabbit hole of vanity metrics that look impressive but don't actually help you make better decisions. The trick is knowing which numbers matter and which ones you can safely ignore.
Let's break it down.
The Metrics That Actually Matter
Traffic Sources
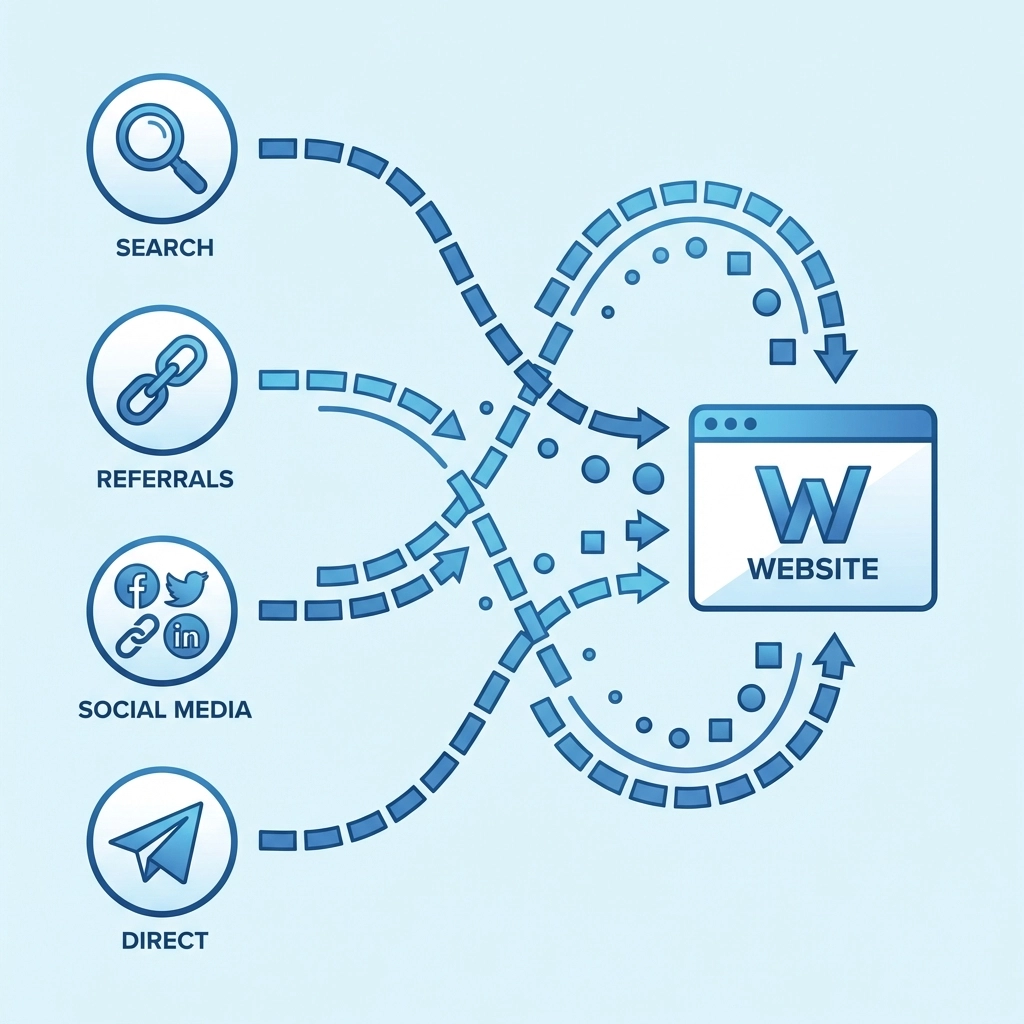
Where are your visitors coming from? This is one of the most valuable pieces of information analytics can give you. Your traffic typically falls into a few buckets:
- Organic search – People who found you through Google or other search engines
- Direct traffic – People who typed your URL directly or had you bookmarked
- Referral traffic – Visitors who clicked a link from another website
- Social media – Traffic from platforms like Facebook, LinkedIn, or Instagram
- Paid ads – Visitors from your advertising campaigns
Understanding your traffic sources tells you which marketing efforts are working. If you're spending hours on social media but 90% of your traffic comes from organic search, that's useful information. You might want to double down on SEO or reconsider your social strategy.
Direct traffic is often a sign of brand recognition. These are people who already know you exist: repeat visitors, loyal customers, or folks who heard about you through word of mouth.
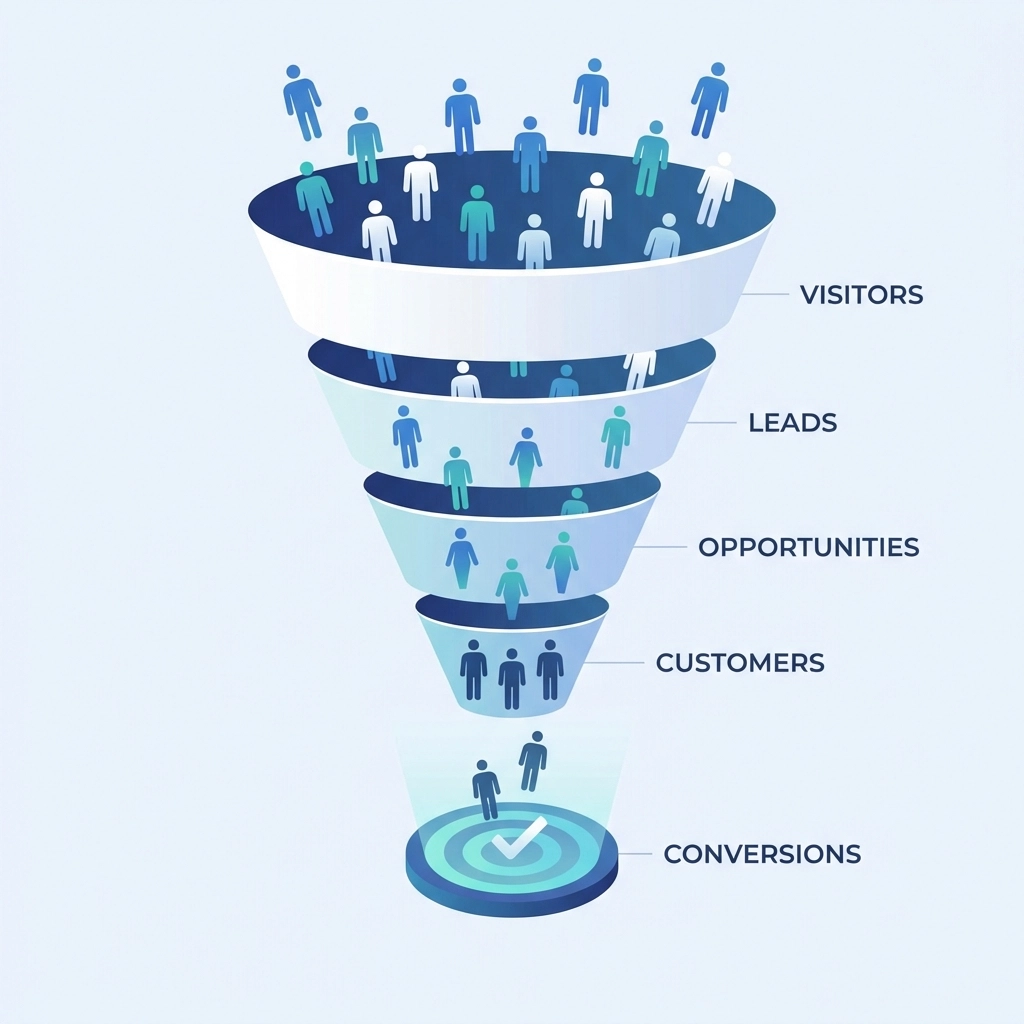
Conversion Rate
This is the big one. Your conversion rate tells you what percentage of visitors are taking the action you want them to take. That might be:
- Filling out a contact form
- Making a purchase
- Signing up for a newsletter
- Downloading a resource
- Calling your business
A website with 10,000 monthly visitors and a 0.5% conversion rate is generating 50 leads. A website with 2,000 visitors and a 5% conversion rate is generating 100 leads. More traffic isn't always better: sometimes improving your conversion rate delivers bigger results.
If your conversion rate is low, it's time to look at your calls-to-action, your page layouts, and whether you're attracting the right audience in the first place. Need help with that? Our web design team can help you build pages that actually convert.
User Engagement Metrics
These metrics help you understand how people interact with your content once they land on your site:
Time on page shows how long visitors spend reading a specific page. Longer times usually indicate engagement, but context matters. A 30-second visit to your contact page is fine. A 30-second visit to a 2,000-word blog post? That's a problem.
Pages per session tells you how many pages the average visitor views before leaving. Higher numbers typically mean people are exploring your site and finding what they need.
Scroll depth (if you're tracking it) shows how far down the page visitors scroll. This helps you understand whether people are actually reading your content or bouncing after the first paragraph.
Bounce Rate (With a Caveat)
Bounce rate measures the percentage of visitors who leave your site after viewing just one page. A high bounce rate sounds bad, but it's not always a problem.
If someone lands on your contact page, finds your phone number, and calls you: that's a bounce. But it's also a conversion. Similarly, if someone reads your entire blog post and gets the answer they needed, they might leave without clicking anywhere else. That's not necessarily a failure.
Where bounce rate matters most is on pages designed to move visitors deeper into your site. If your homepage has a 90% bounce rate, something's wrong. If your blog posts have a 70% bounce rate, that might be perfectly normal.
The Metrics You Can Safely Ignore (Or At Least Not Obsess Over)
Raw Pageviews
Pageviews tell you how many times pages on your site were loaded. It's a big number that can make you feel good, but it doesn't tell you much on its own.
10,000 pageviews could mean 10,000 people visited one page each. Or it could mean 1,000 people visited 10 pages each. Those are very different scenarios. Pageviews without context are essentially meaningless.
Session Duration (As a Standalone Metric)
Average session duration sounds useful, but it's calculated in a way that makes it unreliable. Analytics tools typically measure time by tracking when someone moves from one page to another. If a visitor reads one page and leaves, the session duration is recorded as zero: even if they spent 10 minutes reading.
This metric is better used for comparison over time rather than as an absolute measure of engagement.

Vanity Metrics from Social Media
Your analytics might show social traffic, but be careful about putting too much weight on likes, shares, or follower counts from your social platforms. These numbers feel good but don't always translate to business results.
100 website visitors from social media who convert at 5% are worth more than 10,000 followers who never visit your site.
Geographic Data (Sometimes)
Knowing where your visitors are located can be useful for some businesses. But for many, it's just noise. Unless you're targeting specific regions or your business model depends on location, you can probably skip this section of your analytics dashboard.
How to Actually Use Your Analytics
Set Up Goals
Most analytics platforms let you set up conversion goals. Do this. Without goals, you're just looking at numbers without any real way to measure success. Goals let you track the actions that matter to your business.
Segment Your Data
Generic metrics hide important details. Break your data down by:
- New vs. returning visitors
- Device type (mobile vs. desktop)
- Traffic source
- Landing page
You might discover that mobile visitors have a much higher bounce rate than desktop visitors. That's actionable information: maybe your site isn't mobile-friendly enough. Our web and mobile development team can help fix that.
Look for Trends, Not Snapshots
One week of data doesn't tell you much. Look at trends over months. Is your organic traffic growing? Is your conversion rate improving? Are certain pages consistently underperforming?
Trends reveal patterns. Snapshots just give you anxiety.
Connect Analytics to Business Outcomes
At the end of the day, analytics should help you answer business questions:
- Are we attracting the right audience?
- Is our marketing working?
- Where are we losing potential customers?
- What content resonates with our visitors?
If a metric doesn't help you answer one of these questions, you probably don't need to track it.

The Bottom Line
Website analytics are a tool, not a destination. The goal isn't to have the prettiest dashboard or the biggest numbers. The goal is to understand what's working, what isn't, and where you should focus your energy.
Focus on metrics that connect to real business outcomes. Ignore the vanity numbers that just make you feel good. And remember: data tells you what happened, but understanding why requires you to dig deeper.
Need help making sense of your website's performance? Get in touch with our team and we'll help you turn data into action.